by Andreas Blätte
New polmineR version (v0.7.3) at CRAN!
The new release of the package has seen quite a bit of refactoring. It is the first version that is compatible with Windows. Documentation for many functions/methods has been improved, the package vignette provides an extended introduction to the package. With improved portability and documentation, I hope that more users will find the package useful.
Getting polmineR v0.7.3
The new version of polmineR is available at CRAN and can be installed using the install.packages mechanism.
install.packages("polmineR")Previous versions of polmineR were Linux/MacOS-only packages. It took some effort to learn the techniques necessary to make the package work on Windows (cross-compilation, compiling against an external C library), but I am really happy that things worked at last. The package vignette includes detailed instructions how to install polmineR on Windows systems.
Of course, v0.7.3 is not the end of history. The development version of the package that will include bug fixes and new features will be available at GitHub. The most recent development version can be installed from GitHub using the devtools package.
devtools::install_github("PolMine/polmineR")Feedback I receive how the installation instructions can be improved will find their way into the vignette. The most recent version of the vignette will be available at the development branch of polmineR at GitHub.
If nothing went wrong, the package can be loaded.
library(polmineR)Installing packaged corpora
The last version of polmineR introduced an installation mechanism for corpora indexed using the Corpus Workbench (CWB) in R data packages. See ?install.corpus to learn more. In the following examples, I will use a corpus of parliamentary debates that can be installed from a repository hosted at the project server of the PolMine project.
install.corpus("plprbt.pvs2017", repo = "http://polmine.sowi.uni-due.de/packages")The new polmineR version offers a more robust install.corpus mechanism, and a function to learn about the packaged corpora installed at your system.
packaged.corpora()## package
## 1: europarl.en
## 2: plprbt
## 3: plprbt.pvs2017
## 4: polmineR.sampleCorpus
## lib
## 1: /Library/Frameworks/R.framework/Versions/3.4/Resources/library
## 2: /Library/Frameworks/R.framework/Versions/3.4/Resources/library
## 3: /Library/Frameworks/R.framework/Versions/3.4/Resources/library
## 4: /Library/Frameworks/R.framework/Versions/3.4/Resources/library
## registry
## 1: /Library/Frameworks/R.framework/Versions/3.4/Resources/library/europarl.en/extdata/cwb/registry
## 2: /Library/Frameworks/R.framework/Versions/3.4/Resources/library/plprbt/extdata/cwb/registry
## 3: /Library/Frameworks/R.framework/Versions/3.4/Resources/library/plprbt.pvs2017/extdata/cwb/registry
## 4: /Library/Frameworks/R.framework/Versions/3.4/Resources/library/polmineR.sampleCorpus/extdata/cwb/registryTo access a packaged corpus, the CORPUS_REGISTRY environment variable needs to be reset. That’s achieved calling use.
use("plprbt.pvs2017")
corpus()
## corpus size template
## 1 PLPRBT 83195275 TRUECooccurrences and cooccurrences
The new polmineR version has seen considerable refactoring to make the naming of methods more consistent, and to make the code more maintainable. The biggest intervention is to clearly distinguish between getting the co-occurrences for one query, and getting all cooccurrences in a corpus, or partition.
Cooccurrences for one query are now obtained using the cooccurrences method.
C <- cooccurrences("PLPRBT", query = "Finanzkrise")

bt2008 <- partition("PLPRBT", text_year = "2008")
C <- cooccurrences(bt2008, query = "Finanzkrise")
Note that the output in RStudio now makes use of labels for the columns that somewhat explain the statistical results.
The ‘old’ cooccurrences method to get all cooccurrences in a corpus has been removed from the polmineR package. Don’t worry - it is not gone. It is included in an extension package ‘polmineR.graph’ that is available a GitHub. The big change that has happened for calculating all cooccurrences is that I now use a reference classes to handle the data for all cooccurrences, which can be quite bulky in memory. The huge advantage of reference classes is that objects are not copied, reducing memory consumption. As working with all coccurrences is more advanced anyway, and I did not want to mix the S4 class system and reference classes in a confusing fashion, the Coccurrences class had to emigrate.
Please note that the old context method is not gone, but it is now a worker for the cooccurrences and the kwic method. The reworked context class maintains data on word contexts in data.tables. Very good for speedy operations!
New uses for the size method
The uses of the size-method have been extended. A new sAttribute parameter has been introduced that will give you information how a corpus is spread over the s-attribute specified.
size("PLPRBT")## [1] 83195275size("PLPRBT", sAttribute = "text_year")## text_year size
## 1: 1996 4411730
## 2: 1997 4347053
## 3: 1998 3460238
## 4: 1999 5018672
## 5: 2000 4939232
## 6: 2001 5023673
## 7: 2002 4348155
## 8: 2003 4519408
## 9: 2004 4733993
## 10: 2005 2918442
## 11: 2006 4864127
## 12: 2007 4447858
## 13: 2008 4613932
## 14: 2009 3979244
## 15: 2010 5746965
## 16: 2011 6153061
## 17: 2012 5811442
## 18: 2013 3858050An immediate scenario may be to gain a quick understanding of the data you work with.
s <- size("PLPRBT", sAttribute = "text_year")
barplot(height = s[["size"]], names.arg = s[["text_year"]], las = 2)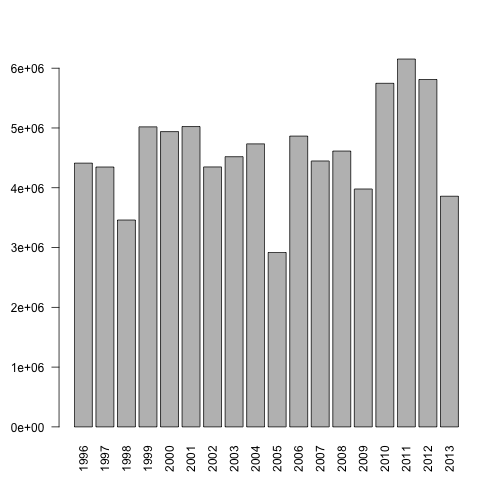
The parameter sAttribute will also swallow a character vector of length 2. The return value of the size method is a data.table (melted format). For our scenario, the dcast will turn it into a useful format.
s2 <- size("PLPRBT", sAttribute = c("text_year", "text_party"))

library(data.table)
dcast(s2, text_year ~ text_party, value.var = "size")
## text_year B90_DIE_GRUENEN CDU_CSU DIE_LINKE FDP NA PDS
## 1: 1996 480763 1385823 NA 551820 552071 304513
## 2: 1997 460860 1402321 NA 551745 524788 315811
## 3: 1998 371204 1044335 NA 414971 476475 249689
## 4: 1999 711423 1261419 NA 512857 556329 379688
## 5: 2000 699345 1276179 NA 490451 496649 387006
## 6: 2001 662800 1300864 NA 507541 555896 375864
## 7: 2002 564455 1162250 NA 406632 557614 224090
## 8: 2003 606008 1435737 NA 437708 471266 NA
## 9: 2004 630489 1491687 NA 481794 490254 NA
## 10: 2005 378114 882152 51099 300078 319841 NA
## 11: 2006 585251 1278723 527004 634767 495279 NA
## 12: 2007 535019 1159138 497965 546794 482319 NA
## 13: 2008 562076 1145125 538282 611905 549195 NA
## 14: 2009 470969 990411 448032 511865 630498 NA
## 15: 2010 653804 1801451 625597 869537 612583 NA
## 16: 2011 717613 1998158 716743 911844 583275 NA
## 17: 2012 356517 1843056 689859 906820 835819 NA
## 18: 2013 243975 1214828 453705 577209 624360 NA
## SPD fraktionslos parteilos unbekannt
## 1: 1134280 NA 2460 NA
## 2: 1091528 NA NA NA
## 3: 903564 NA NA NA
## 4: 1596956 NA NA NA
## 5: 1589602 NA NA NA
## 6: 1619868 NA 840 NA
## 7: 1409593 23521 NA NA
## 8: 1493271 75418 NA NA
## 9: 1552827 86942 NA NA
## 10: 945017 42141 NA NA
## 11: 1337809 5294 NA NA
## 12: 1213054 13569 NA NA
## 13: 1192857 14492 NA NA
## 14: 918275 9194 NA NA
## 15: 1183711 NA NA 282
## 16: 1225428 NA NA NA
## 17: 1179371 NA NA NA
## 18: 742438 1535 NA NAAn enhanced sAttributes method
I would not guess that anybody apart from myself might have discovered the old meta-method to learn about the metadata of regions of text. It has always been a worker. Now it is gone, and the functionality has been integrated into the sAttributes method. The sAttribute parameter is not limited to length 1 character vectors any more. If more than one string is provided, you get a data.table with the combinations that are available in the corpus.
y <- sAttributes("PLPRBT", sAttribute = c("text_date", "text_name"))
y2 <- y[text_name == "Dr. Angela Merkel"]
y2[1:5]
## text_date text_name
## 1: 1996-02-28 Dr. Angela Merkel
## 2: 1996-02-28 Dr. Angela Merkel
## 3: 1996-02-28 Dr. Angela Merkel
## 4: 1996-02-28 Dr. Angela Merkel
## 5: 1996-02-28 Dr. Angela MerkelFurther changes, features and improvements
-
The way you can index objects inheriting from the textstat class is more consistent than previously, and mimicks that style you can index data.tables. See
?"textstat-class"to learn more. -
Managing encodings has been reworked to achieve Windows compatibility. Two new functions (as.corpusEnc and as.nativeEnc) have been introduced for encoding conversion.
-
The count-method for a whole corpus (as provided by a character vector) will now work when more than pAttribute is provided.
-
There are some speed improvements for generating the html that is prepared by the read-method. A previously hidden highlight-method is now exported. It is faster and definitely more robust than before, as the xml2 package is used to parse and enhance html.
-
My old implementation of progress bars for multicore operations has never been stable in a satisfactory fashion. polmineR now relies on the pbapply package that is specialized on that task.
-
To make the package as reliable as possible, I have started to use the testthat package to include unit tests. We want to discover unintended errors.
An easter egg: An integrated shiny app!
Before I forget that… There is an experimental shiny app included in the package! It offers GUI access to core methods of the polmineR package (count, cooccurrences, features, dispersion). In fact, the app is meant to serve as a tutorial to the functionality of polmineR. It is experimental, but to check it out type:
polmineR()Many of the changes that package has seen serve the purpose of providing a consistent backend for the shiny app. There will be more development in that respect.
Further perspectives
There has been a lot of refactoring behind the scences to ensure that the package is portable and to improve performance. Documentation should be much better than before. Feedback on advice is highly welcome, and we certainly plan to offer more tutorials, examples and advice.
A consequence of the refactoring of the context/cooccurrences method has been that some functionality was not immediatly re-implemented. That’s planned for v0.7.4.
I am happy that there is a growing community of users. I am looking forward to your advice, and to making this an increasingly useful package.
Subscribe via RSS